We'll test a dashboard which lists failed jobs: a page has five jobs on it, and the question is whether a change to the code which loads them has reduced the work the database has to do. We could test what happens when we load every page, but then we would be testing something else, so we'll do that separately.
This version of the example has a hundred candidate jobs, returned in a fixed order. The database doesn't decide which five to show on its own: there are some checks in the application, too.
Testing is simple, at least in principle. The old code gives us a reference for the new code: we run both against the same data and see what work each one does. There is code collecting those measurements too, and we need to know that it works (maybe it missed a batch of results, for example), which means a second comparison before we can make the comparison we wanted.
Here we assume the application is doing some filtering of its own and is using MongoDB to fetch candidate jobs. To get a page up on the screen which has five jobs on it, and to be able to offer an enabled Next page button, we need six qualifying jobs. Note also that some candidates won't pass the application checks, but we can go through them in batches. Twenty will do for this example - it's a setting, not a requirement.
If you're wondering why we're getting twenty when we want five, it's so we don't make a network request for each candidate, and because five candidates might not give us five usable jobs. Suppose six of the first twenty qualify. Once we have five plus the extra one, we can close the cursor. Of the hundred candidate jobs in this example, we fetched twenty. Those gave us enough matches, so we never requested the remaining eighty.
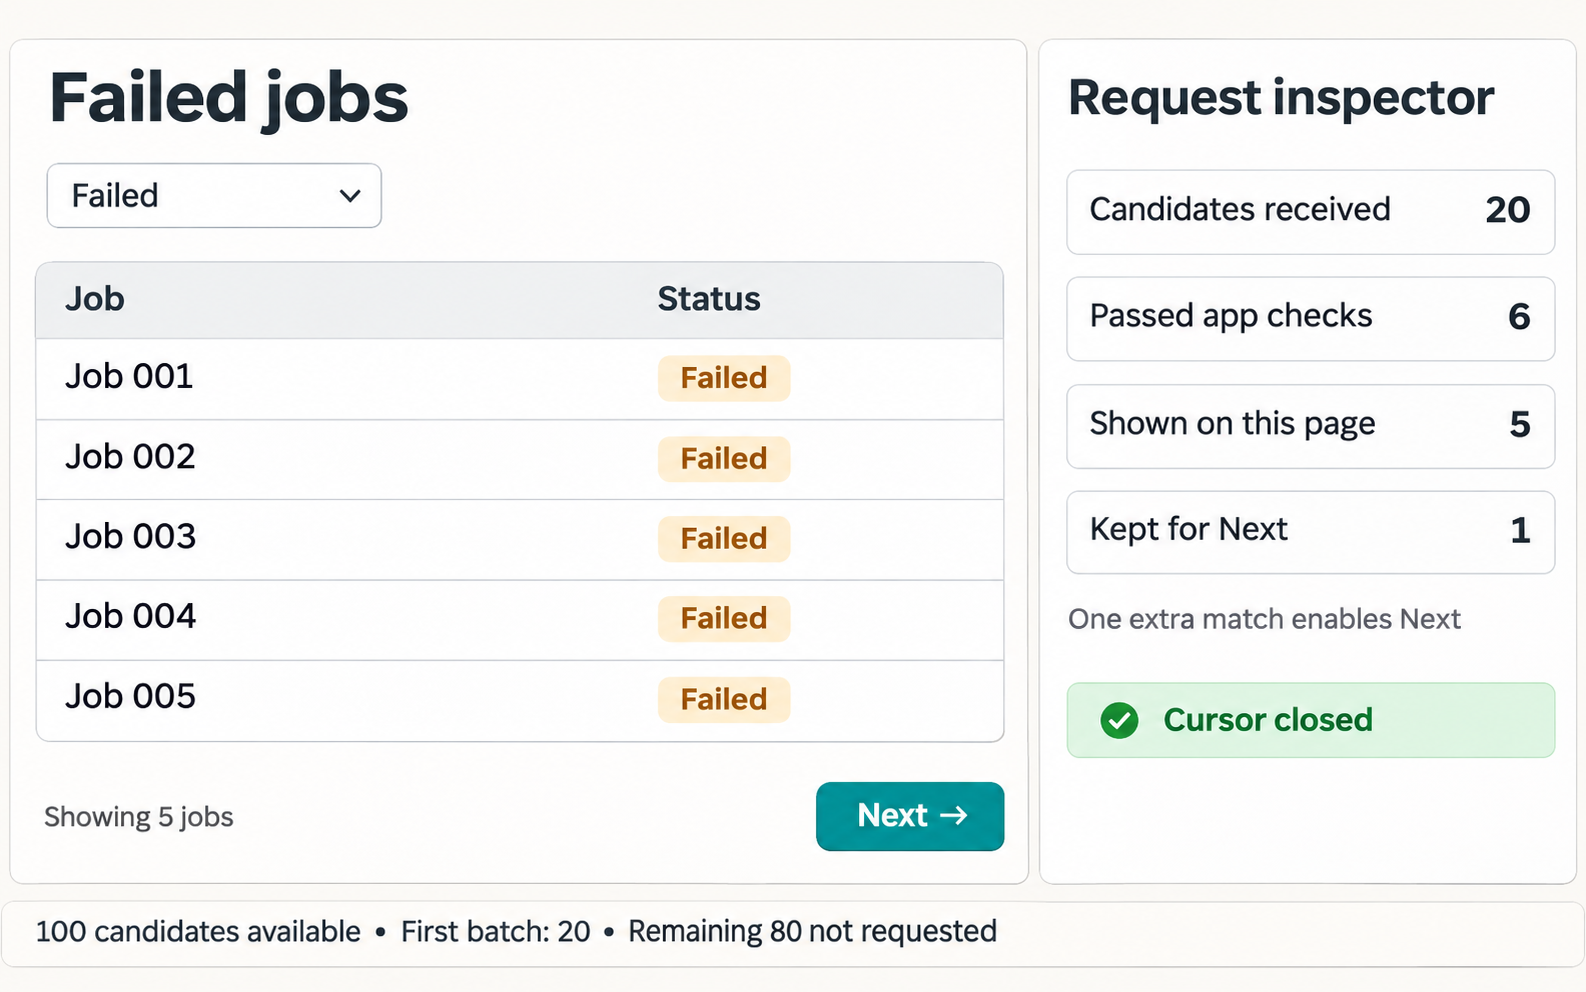
A cursor is the stream of database results; closing it ends our read.
A database profiler is a tool for recording what ran (meaning the database operations which actually happened, not the ones we expect to happen) which provides the benchmark with some numbers for comparison. Those include documents examined, index entries scanned, and records returned, for the query and for requests for further batches.
What this gives us is a record of the database work for our page request. Documents are MongoDB's word for records. Twenty records returned doesn't mean twenty documents examined; the database might have examined more to find the twenty it returned. None of this tells us the elapsed time or the bill, either. To compare the old code with the new code, we need to collect these records for both, making sure we haven't missed any batches along the way.
Then we run the same query again, to check the measurement.
MongoDB's explain("executionStats") is a way of running a query which lets us see the work counters for its execution (the profiler records work too - that's why we can compare them), but it does so by running the query to completion. We get statistics back, not a hundred jobs for the page. We're expecting the counters from this second run to agree with the counts we collected for the application request.
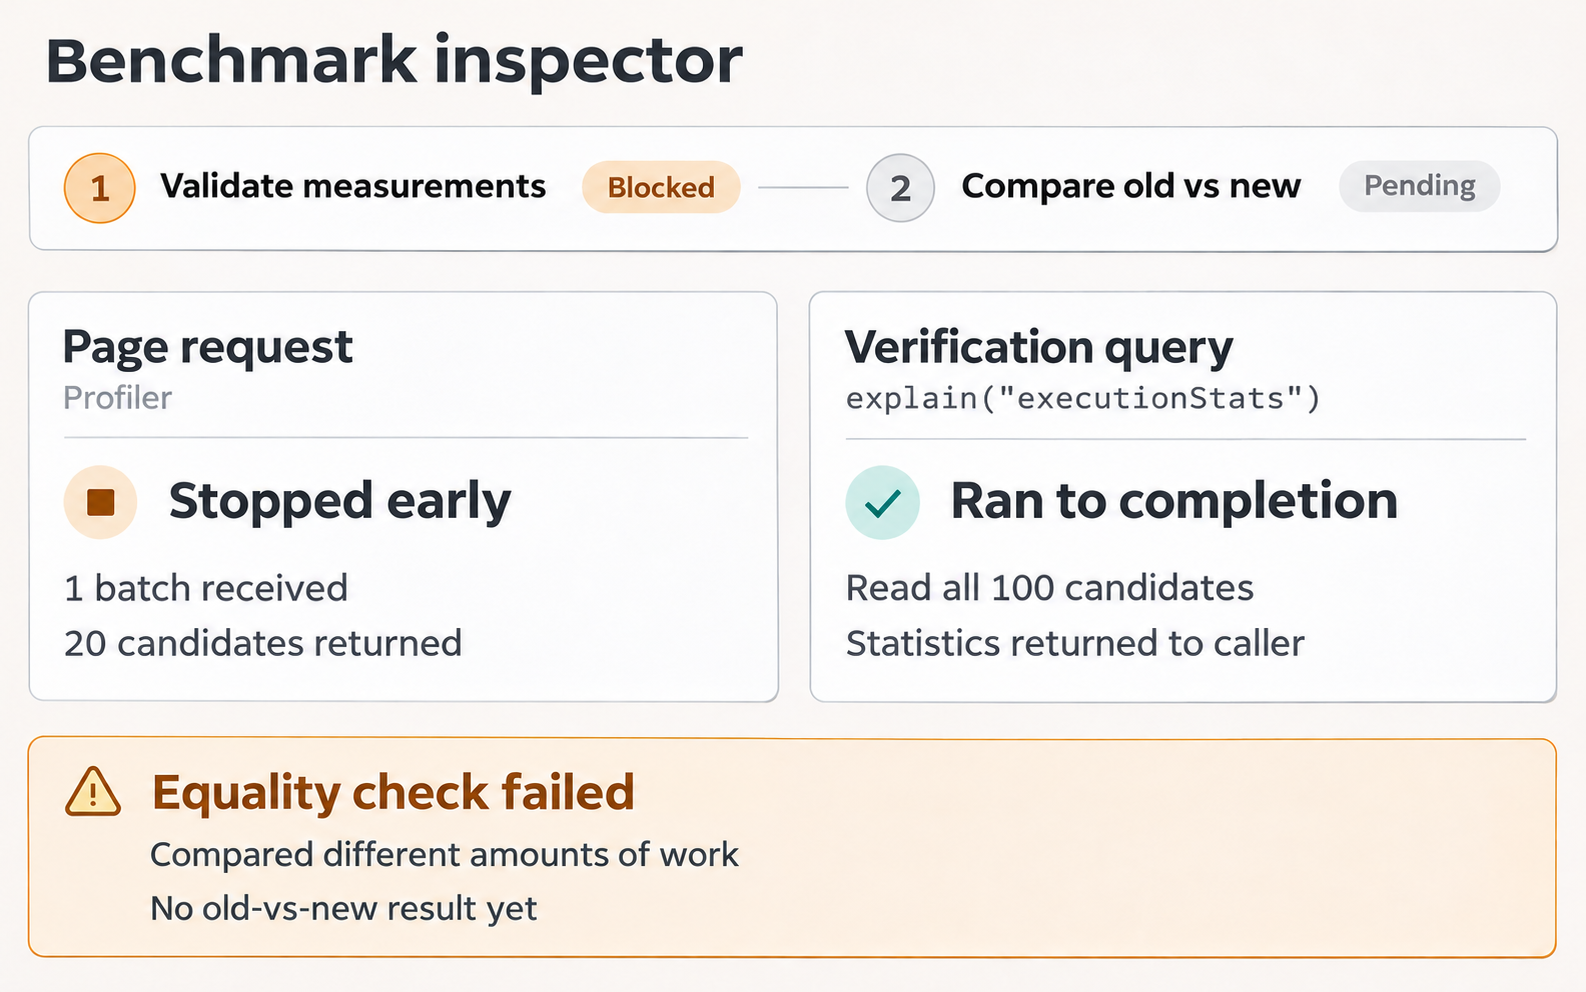
The equality check is useful only when checking a complete execution - which will be the case if there aren't enough qualifying jobs for the page. With only three in all hundred candidates, for example, we have to read all hundred to establish that there aren't five. We can then compare complete executions on fixed data, with matching query settings. In our first-batch example we don't finish the query, and requiring the same counts anyway is what blocks the benchmark. Rejecting the measurement doesn't tell us that the new code is slower or wrong, though; we haven't got as far as comparing it with the old code.
So for an early stop, we check the request that actually ran instead. For example, an assertion (a check) that the profiler counted twenty returned records is correct if the client received twenty. But if we assert that it counted twenty and its count is nineteen, the checking code will mark this assertion as false. This is a failed check. We expected twenty, and didn't find it. Obviously, in the benchmark we won't be checking a hard-coded twenty - instead, there'll be actual batch records from this request to compare against the returned counters, but you get the idea.
The server's work counters need a consistency check against this request's own execution records, not another full run of the query, and we also check that the cursor closed. For a request which does read the query to the end, we can still use the complete-query comparison, since the early-stop problem doesn't apply to that request.
The other tests are useful for finding out whether the application still does what we want it to do. Those include checking that we got the expected jobs, that they're in the right order, and that going through every page works. To measure the full walk we have to walk through all the pages, and do that separately from the first-page measurement. We should leave our extra verification queries out of both measurements. They are extra queries, after all, and you don't want a number which includes the database work you did to find out how much database work you did.
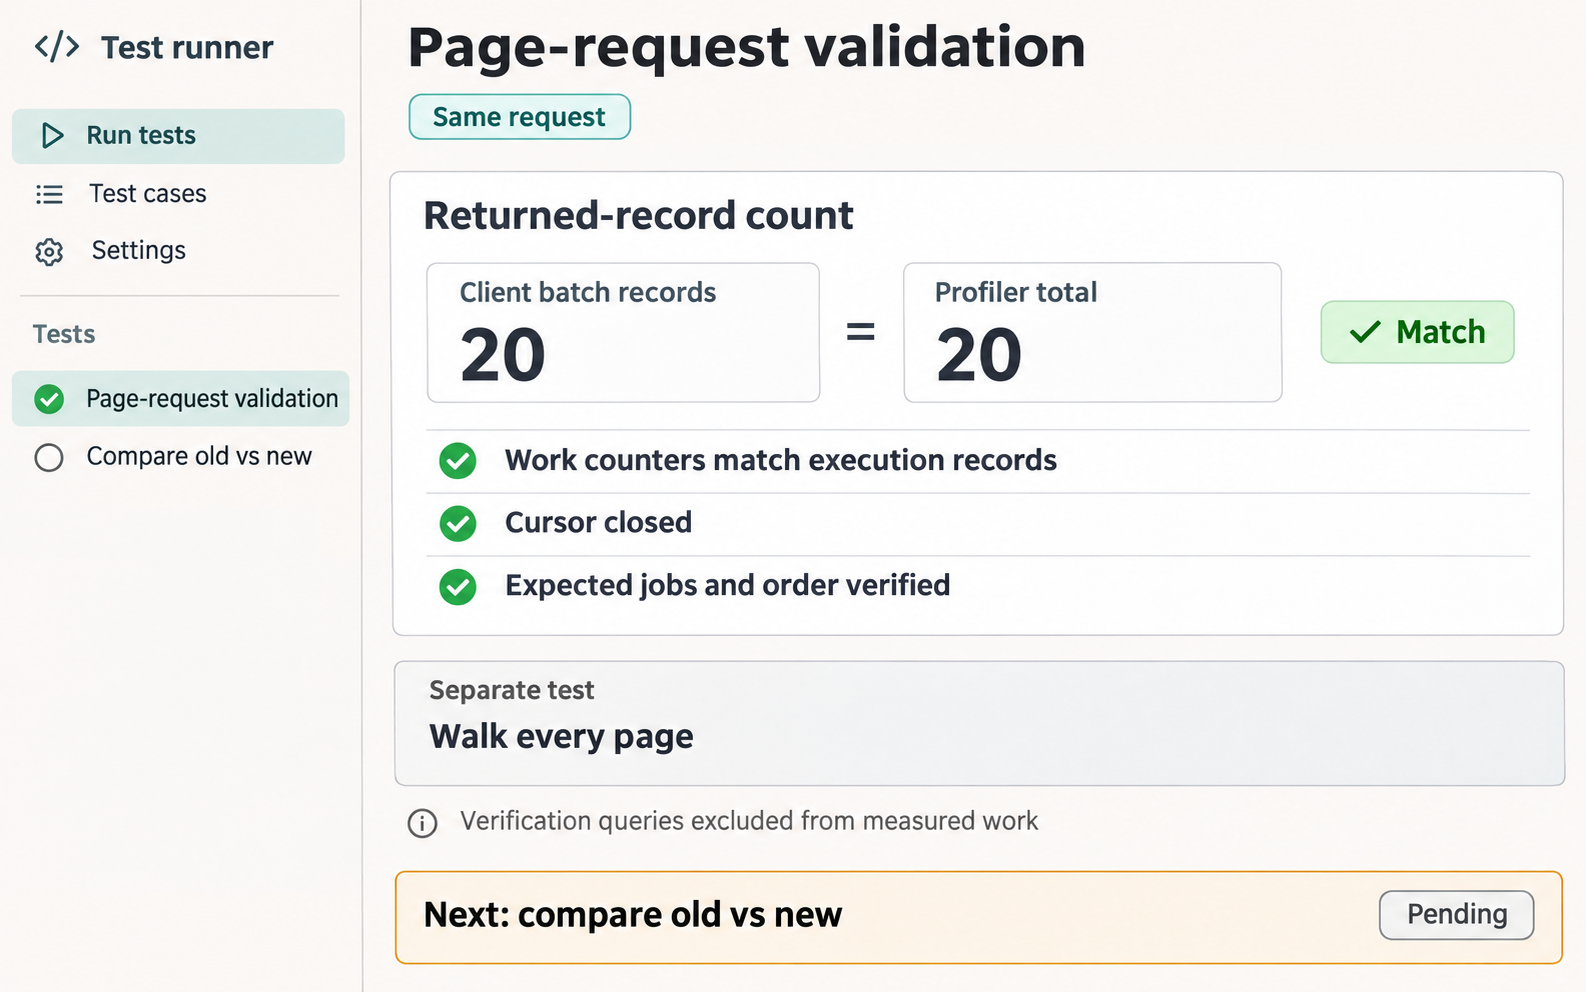
This only fixes the check, and we still need to compare the old code with the new code - we'd be getting ahead of ourselves if we called it an improvement already.